Bar Graph Generator is a free online tool that allows users to create custom bar charts instantly without the need for Excel or complex software. This web tool is designed for students, professionals, and researchers who need to visualize data quickly and efficiently.
bargraphgenerator.online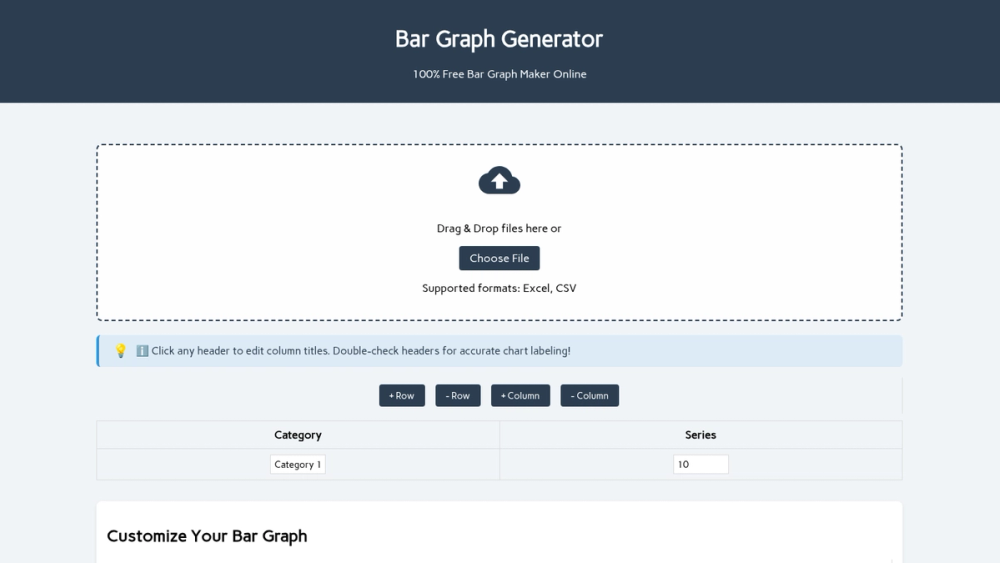
Bar Graph Generator is a user-friendly, free online tool designed to help users create custom bar charts quickly and efficiently without the need for Excel or complex software. Ideal for students, professionals, and researchers, this web tool simplifies the process of data visualization by allowing users to input their data directly, paste from spreadsheets, or drag-and-drop files in supported formats such as Excel and CSV. Users can then customize their bar charts by adjusting colors, orientations, and formats (vertical, horizontal, stacked, or grouped) before exporting the final product as a high-definition image or embedding it directly into websites or blogs.
Bar graphs, which use rectangular bars to compare different categories of data, are essential for spotting trends, comparing datasets, and making data-driven decisions. The Bar Graph Generator streamlines this process by offering an intuitive interface with no learning curve, full customization options, and cross-platform compatibility. It ensures privacy by processing all data in the user's browser and uses the trusted Chart.js library for precise calculations.
The tool is versatile and serves a wide range of users, including students creating presentation aids, marketers analyzing metrics, researchers compiling data, teachers developing materials, and small business owners tracking KPIs. With no technical expertise required, the Bar Graph Generator offers a hassle-free solution for creating professional bar charts instantly, making it a valuable alternative to traditional spreadsheet software.
Information shown may be outdated. Found an error? Report it here